BLOG
Measuring Media Coverage: Using Google Sheets to Track Efforts Beyond Impressions
As PR professionals, we are often asked how we can measure the value of our efforts. Common ways we measure success are by counting the total number of articles, impressions, and opportunities garnered. Today, these numbers are table stakes. Clients want to know the who, what, when, where, and why of how coverage translates to opportunity.
No matter the size of your client account, it is important to track much more than just these metrics to see a full picture of how your account is performing. Formal trackers can host all of this information – and more – and can be analyzed easily.
Let’s dig into some key items that might provide more insights to your client than you think.
- Publications: When you kick off with a new client, it is important to identify what they consider “core” publications compared to “reach” publications. Core publications should be the trade or national publications that specifically cover your client’s industry. Reach publications are exactly how they sound – a reach – and should be acknowledged as achieving a major PR milestone! When it comes time to show off your work, you can verify how many times your team garnered coverage in core and reach publications, which are measurable results to share with your clients.
- Links: PR professionals don’t have much control over what makes it into an article. But, we should always strive to include a link to the clients’ website or another owned asset that reporters can include. In this case, using UTM links are key, as they can be used to track how many users or sessions were garnered from the specific piece of coverage. Although some reporters might strip the UTM link (or any link), it is important to try to track the work that has driven readers to the clients website.
- Spokespeople: A company can have multiple spokespeople and it’s important that you keep track of who is utilized for media opportunities. Ask yourself: Who was the author of the byline? Who was quoted? Was it an executive at the company, a customer, or an industry influencer? Having a broad bench of spokespeople who are able to speak on a range of topics can increase visibility of your clients’ company across different publications. Additionally, utilizing customers to speak on behalf of your clients will significantly boost credibility, which is invaluable to your business.
- Source: PR professionals spend a lot of time pitching reporters, which isn’t always accounted for, or remembered when there are big wins. One way to keep tabs on where opportunities and coverage originated is to keep track of the pitches that sealed the deal. For example, if you sent out predictions from your client and garnered four opportunities and seven pieces of coverage – you should track that. Then, when it comes time to prove the value of pitching you can confidently share the numbers. Numbers don’t lie!
Creating the Perfect Coverage Tracker
Spreadsheets are a fantastic place to build media coverage trackers. As an agency that has accounts that vary greatly in size and effort, below is an example of a thorough media coverage tracker for any client built in Google Sheets.
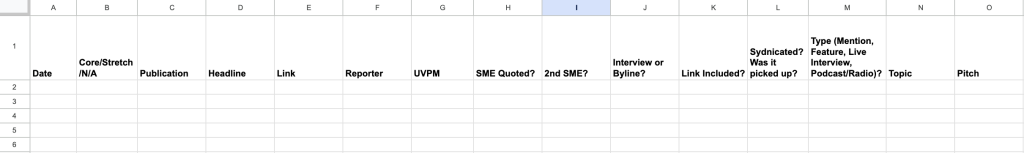
First, you will either want to create a new Google Sheet or a new tab in an existing Sheet. Then, you will identify the columns, such as the type of coverage (live interview, feature, podcast, etc.), the pitch the coverage originated from, syndication, links included, and the spokespeople who were mentioned or quoted. You will then want to set up specific data validation rules for the different columns in the sheet.
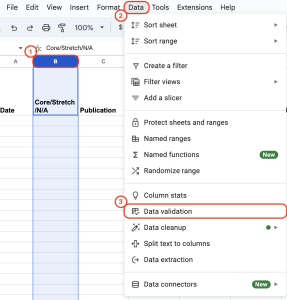
- Select the column you want to categorize. For example, Column B is chosen (Core/Stretch/N/A).
- Click Data.
- Click Data validation.
The data validation rules window will appear to the right of the screen. Here you can continue to customize the data you want to see in each column.
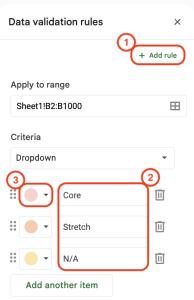
- Click + Add rule
- Add as many rules as needed. For example, a Core category, a Stretch category, and a N/A category were added.
- Choose different colors for each rule created. Color coordination can be great for organizing.
Google Sheets allows you to choose different colors for the various categories. You can also select Customize to personalize the tracker to your clients’ brand-specific colors.
Next, you’ll want to set up the column statistics for the rules you just created and compare them across columns.
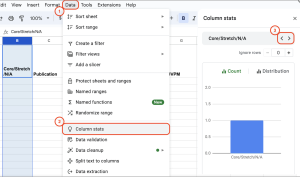
- Click Data again to pull the numbers you need for the rules you’ve set.
- Select Column stats. A sidebar will appear, which will showcase graphs and different stats related to the specific column you are analyzing.
- Click through the left and right arrows to see the stats of the different columns in your sheet.
Keeping track of your PR successes should not only be easy, but provide your clients an in-depth look at everything they need whenever they need it.
Interested in learning more about how Zer0 to 5ive’s PR team can help drive your company’s visibility and industry leadership? Contact us today.